August 31, 2021 |
James Messi
On-chain analytics is a growing field that measures different aspects of a blockchain to get a better sense of the fundamental value that it derives from having active users and generating revenue through network fees.
What are On-Chain Analytics?
On-chain analysis was not possible until the emergence of blockchain technology in 2009. In traditional financial and speculative markets, most transaction and activity data are kept private. Leaving retail investors on the wrong side of an information asymmetry for decades. Thanks to Satoshi Nakamoto’s innovations with Bitcoin’s blockchain, we now have a robust economic system that captures and immutably stores all transaction and activity data.
As Bitcoin’s blockchain is fully transparent, anyone can use online services to look up the full history of the ledger. Giving every market participant the clearest and most granular data that they can compile and turn into useful information. That, in essence, is on-chain analysis.
For instance, every time new bitcoin are mined, the wallet address of the miner is publicly displayed with the rest of the transaction data. We can use this address later to determine what the miner did with that bitcoin. We can see the miner’s wallets collectively and figure out how much bitcoin there holding or selling. We can determine the time between mining new coins and unloading them into the market. As well as the number of fees collected in each block. And going one step further, you can analyze differences in behavior between retail and institutional participants by tracking wallets with the highest and lowest amounts.
Anyone can use this data to get a clearer picture of the overall market sentiment at a given time. That being said, it’s important to note that on-chain indicators are typically used to make medium or long-term decisions and can not account for certain externalities that affect price in the short term.
On-Chain Analytics: Top Indicators to Follow
With on-chain indicators, you can start to look at BTC more like a publicly traded company to gauge whether it is over or under-valued at a given time. In that case, consider Bitcoin’s network fees to be its revenue. Those figures can be paired against network usage and actual exchange rates to determine when bitcoin is at a relatively good price to buy at.
The top on-chain indicators to follow include the RHODL Ratio, MVRV, SOPR, Whale Wallets, and more.
RHODL Ratio
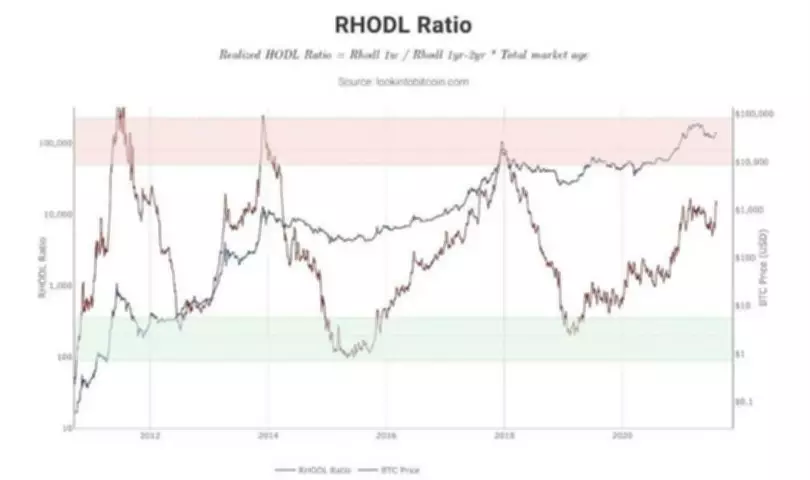
The RHODL ratio compares the amount of bitcoin that has been held in wallets for one week or less, against the total amount of bitcoin that has been held in wallets for more than two years.
When the RHODL ratio gets too high and reaches the red box, the short-term holders own a relatively larger slice of the pie. That is generally a sign that the market is getting frothy and may be headed for a correction.
The MVRV Ratio
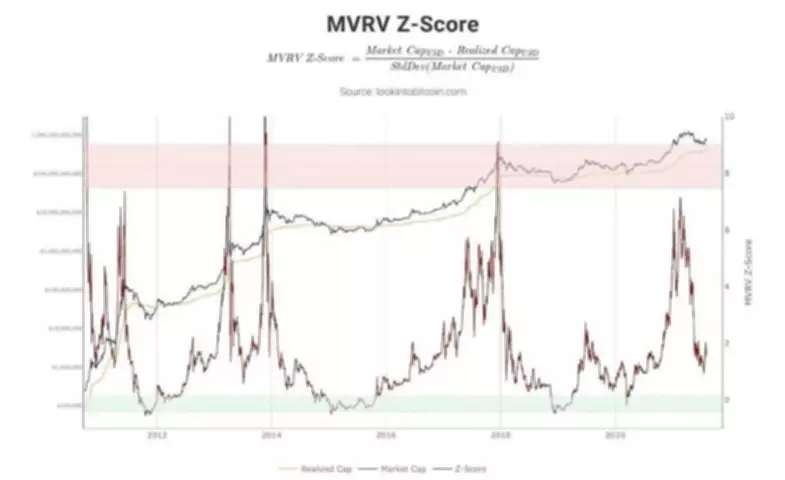
The MVRV score compares bitcoin’s market capitalization, in USD, against its realized value. In this case, realized value is represented as the average USD value of each bitcoin every time BTC is transferred, over a specified time frame.
When the market value is significantly higher than the realized value, the MVRV score reaches the red panel at the top. Another sign that the market has overheated and needs to cool down.
Spent Output Profit Ratio (SOPR)
The ratio of spen output profits looks at the percentage gain or loss of all bitcoin buys and sells. The SOPR gives us a sense of whether the network as a whole is making or losing money as a result of changes in the price of bitcoin. When this ratio is high, the average buyer or seller of bitcoin is in profit. When the ratio falls, the average participant is losing value relative to USD.
Whale Balances
In crypto slang, a “whale” refers to someone that owns millions of dollars or more in cryptocurrency. Whale’s wallet addresses tend to get the most attention as every type of speculator is interested in what the big money players are doing.
Unlike traditional markets like stocks and bonds, we can utilize the blockchain to follow the exact moves of the whales.
In bitcoin terms, let’s say a whale is someone with 100 or more bitcoin. We can leverage on-chain analysis to keep an eye on them and track whether they are accumulating bitcoin or distributing it back into the market, at any given time.
Miner’s Wallets
Miners spend a lot of time thinking about bitcoin. It’s fair to assume that miners, collectively, have a much better undersigning of the market than the average participant. Using the blockchain to follow the buying and selling patterns of mining wallets can give you a clear picture of miner’s sentiment.
Long-Term Vs. Short-Term Holders
Much like the RHODL ratio looks at the behavior of long-term holders vs short-term holders. when you see a trend begin to form with long-term holders selling, you may be near a top and headed for distribution selling.
Exchange Transfers
Determining the amounts of bitcoin that is moving into or out of cryptocurrency exchanges can tell us more about the broader sentiment at any given time. When you see a large number of bitcoin flowing out of exchanges, whales have accumulated and are parking their coins somewhere safe. Conversely, when you see 4 digit BTC inflows to exchanges, those coins are typically put up for sale soon afterward.
Getting Started with On-Chain Analytics
To track these indicators and refine medium to long-term decision making, check out services like LookIntoBitcoin and CryptoQuant.
For high-confidence indicators that can be applied to short-term trades, check out Signals by Beaxy before you pull the trigger.